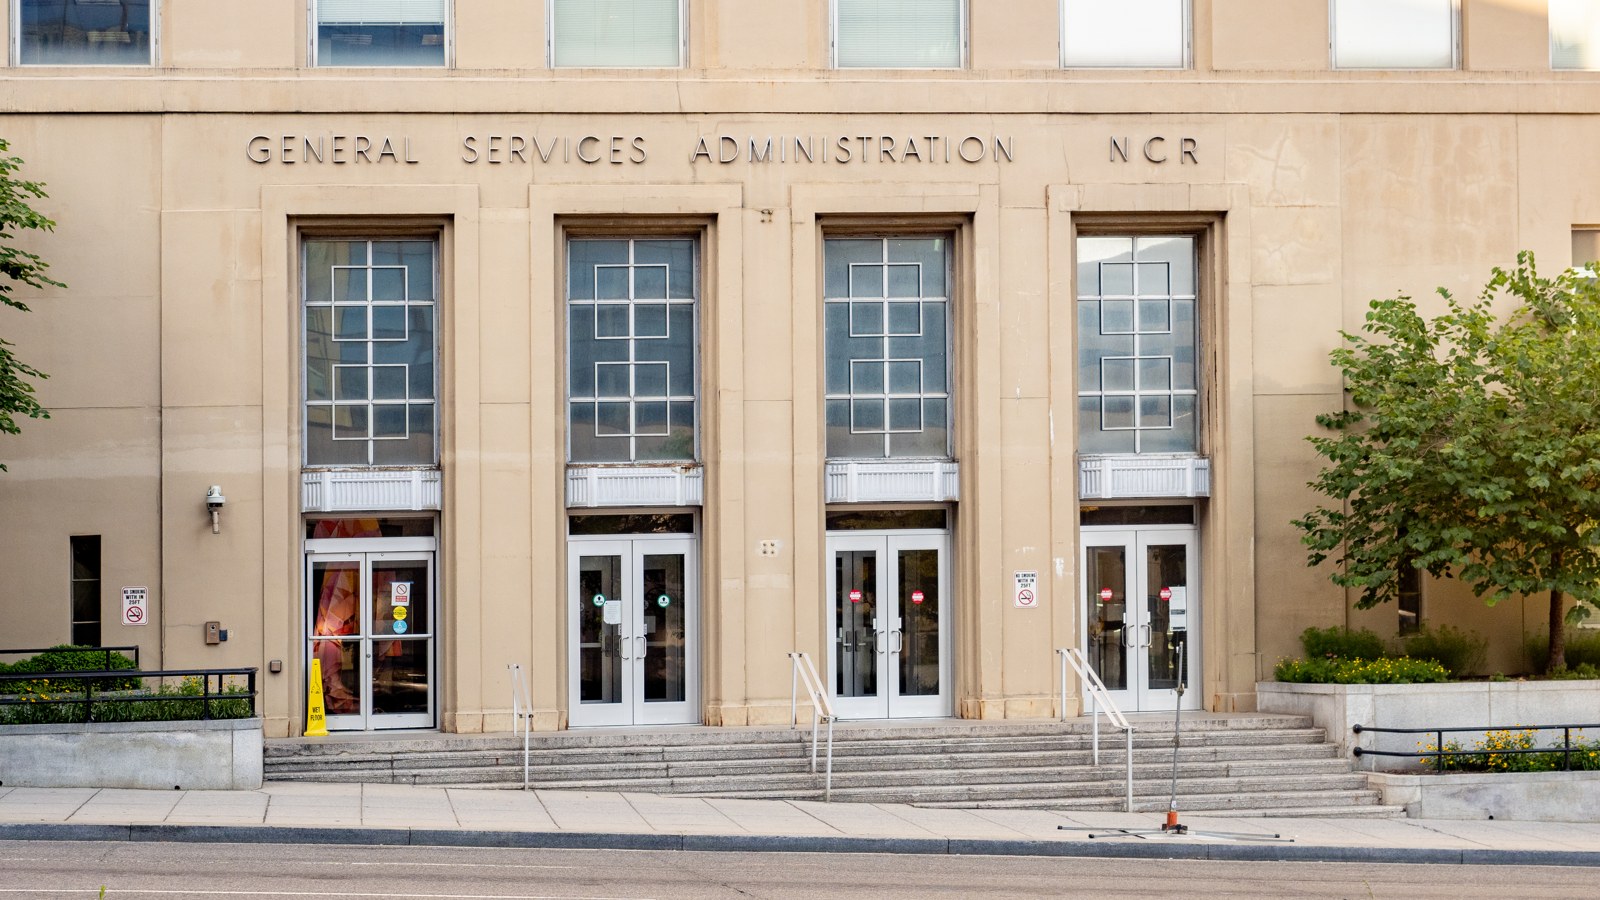
The missing space is mostly inside other locations
Federal office-utilization reporting omitted more than 20 million usable square feet of vacant General Services Administration space, but most of that vacancy was not in completely empty buildings. What’s the Scoop With Broach reconciled the exact figures in a newly public federal audit and found 77.1% of the omitted vacant area was inside partially occupied buildings or leases.
That distribution matters to oversight. A building with federal employees arriving every day can still contain unassigned floors that are absent from its reported utilization denominator. Conversely, another exclusion from the public dataset removes relatively highly used spaces. These two omissions point in different directions and should not be combined into a single claim that all government offices are emptier—or fuller—than reported.
The October 15 GAO report, publicly released October 16, evaluates implementation of the USE IT Act. Our accountability question is whether Congress and the public can identify which spaces actually need consolidation when the reporting unit is often an agency’s occupancy agreement rather than a complete building.
Recalculating the vacancy table
Table 2 lists 15,616,173 vacant usable square feet in 724 partially vacant locations and 4,627,682 square feet in 155 fully vacant locations, with a printed grand total of 20,243,856 square feet across 879 locations. The two component area figures add to one square foot less than that printed total; we retain the source’s reported total for this calculation rather than silently changing it. Dividing the partially vacant area by the total produces 77.14%; dividing the partially vacant locations by all locations produces 82.37%. An area share and a location share measure different things.
The same table separates 15,045,226 square feet in GSA-owned buildings from 5,198,630 square feet in leased space. These are July 2026 vacancy records used to illustrate omissions in March 2026 utilization reporting. They are not a newly measured October vacancy inventory, and the elapsed time prevents treating every listed location as still vacant today.
GAO identified 72 partially vacant GSA-controlled spaces—55 owned buildings and 17 leased spaces—that reported utilization at or above 60% but could fall below that threshold if vacant space were included. One California building’s illustrative calculation moves from 68% to 57%; a Michigan lease moves from 78% to 58%. The report does not identify those examples sufficiently for us to name particular facilities, and we do not assign them addresses.
The significance is not merely cosmetic. After the 2027 reporting cycle, the act directs GSA, in consultation with the Office of Management and Budget, to take space-reduction steps for locations below the threshold for two consecutive years, with specified exceptions. Missing vacant area can therefore affect how a location appears relative to a consequential benchmark.
A second exclusion works in the other direction
The public GSA dataset discussed in the audit includes individual spaces below 60% utilization but omits individual spaces meeting or exceeding it. GAO reports that 22% of agencies’ spaces with active occupancy agreements met or exceeded the threshold. Leaving those out can make the public file look like a complete inventory of low-use property when it is a selected subset.
GSA told GAO it complied with the statute, which calls for reporting on occupied spaces, and said adding vacancy could confuse GSA’s own operating-space utilization. Its October 2 response also said it had clarified the public dataset’s scope. GAO acknowledged explanations on overview and individual-agency pages but maintained that the full dataset’s page still needed a clear explanation of the exclusion.
We checked that live submissions page on October 16. Its accessible text carries a broad disclaimer about incomplete, outdated or inaccurate data and third-party sources; that disclaimer does not itself explain the two different selection issues described in the audit. We did not extract a new full occupancy dataset or claim to recompute nationwide attendance.
Useful data still require context
The record also shows practical benefits. Agencies described using new occupancy information to support lease reductions and consolidations, including expected annual savings of about $885,000 at the Small Business Administration and $1.6 million at Energy. These are agency-reported estimates in the audit, not savings independently collected by this publication.
GSA said utilization would be considered alongside mission needs, renovation costs and other information. Some agencies argue that including kitchens, conference rooms or holidays depresses their rates; excluding those areas entirely can instead overlook space that could be reconfigured. The report therefore recommends evaluating the calculation’s effects, not simply deleting inconvenient categories.
Our contribution is a reconciliation of the vacancy table, threshold examples, public-file exclusions and GSA’s written answer. All four recommendations remained open on the official page checked October 16. We did not visit buildings or interview federal workers. The reviewed record establishes incomplete context in a new measurement system, not that every vacant square foot can immediately be sold or every projected dollar has been saved.
Sources and further reading
Official publication and recommendation status checked October 16, 2026 ↗
GSA live USE IT Act agency-submissions page and data disclaimer, checked October 16, 2026 ↗
GSA occupancy and utilization reporting guidelines ↗